 LA·iMageS

Tutorial
This quick-start tutorial will guide you through all the steps needed to (i) prepare a dataset for analysis, (ii) load and analyze it, (iii) understand the main user interface of La-iMageS, and (iv) customize the elemental distribution images.
Contents
Input data
LA-iMageS takes as input datasets generated by ICP-MS instrument control software and exported in the Perkin-Elmer Elan 'XL' format (*.xl). Each dataset should be placed in a folder containing the *.xl files corresponding to each data line taken by the ICP-MS instrument. The following listing shows an example of a valid XL file.
Intensity Vs Time, Counts Per Second
Time in Seconds ,SeO96,SO48,C13
0.,0.,290.0050460878,1250.093757031

0.,0.,280.00470407903,1230.090780699

0.,0.,630.0238149002,1150.079355475

0.,0.,2010.2424352377,1230.090780699
Note that each line file must contain a number that indicates the order in which each line has been acquired by the ICP-MS instrument. For example, if you have a dataset with 10 lines, a valid set of names can be: line 1.xl, line 2.xl, line 3.xl, line 4.xl, line 5.xl, line 6.xl, line 7.xl, line 8.xl, line 9.xl and line 10.xl.
Additionally, the dataset folder may contain two configuration files: parameters.conf and positions.txt.
The parameters.conf file
The parameters.conf file is used to store the ICP-MS data acquisition parameters:
- Standard: the standard element in the dataset. The other elements will be normalized using this element as standard.
- Acquisition time: refers to the time needed by the acquisition of one point for all elements monitored by the ICP-MS.
- Ablation speed: speed set by the user in the laser operational mode as continuous firing.
- Space interval: is the distance among the center of two lines.
This file is optional and it is used by the Load Data operation in order to automatically load the acquisition parameters. If this file is not present in the dataset’s directory, user must explicitly introduce them. The following listing shows an example of a valid parameters.conf file.
standard=C13
ablation.speed=0.06
acquisition.time=0.324
space.interval=0.12
The positions.txt file
The positions.txt file is used to store the physical position of each line in the instrument during the ablation process. The following listing shows an example of a valid positions.txt file.
LINE
16.5460,31.3610,4.4210
17.5140,31.3610,4.4210
LINE
16.1270,31.2410,4.4210
17.9880,31.2410,4.4110
LINE
15.9720,31.1210,4.4150
18.7480,31.1210,4.3550
LINE
15.6940,31.0010,4.4150
19.0860,31.0010,4.3250
This format consists in blocks that starts with by keyword LINE followed by at least two lines of three comma-separated numbers (X, Y, Z). The first and last lines of numbers represent the initial and final positions of the corresponding line. There must be the same number of LINE blocks and *.xl files.
This file is optional and it is used by the LA-iMageS software in order to read line's positions and determine whether they are horizontal or vertical: if each line has the same X position and Y initial and final positions are different, it means that it is vertical; otherwise, if each line has the same Y position and X initial and final positions are different, it means that it is horizontal. If this file is not present in the dataset’s directory, then La-iMageS will consider that lines are horizontal and will automatically generate its positions based on the acquisition parameters.
Analyze data
The analysis execution is started by clicking on the Analyze Data button of the toolbar, which will show you the Analyze Data dialog. As you can see in the following figure, this dialog requires you to introduce the ICP-MS acquisition parameters:
- Data directory: the directory where the dataset to be analyzed is stored.
- Standard: the standard element in the dataset.
- Ablation speed: speed set by the user in the laser operational mode as continuous firing.
- Acquisition time: refers to the time needed by the acquisition of one point for all elements monitored by the ICP-MS.
- Space interval: is the distance among the center of two lines.

If the parameters.conf file is present in the data directory, then the data acquisition parameters are automatically loaded. You will notice that loaded parameters are highlighted with a green background.
Main user interface
Once the analysis execution finishes, a new analysis result will appear in the clipboard and in the Analysis viewer panel.
In the following figure, you can see the general aspect of LA-iMageS. The main user interface of La-iMageS is organized into three main sections: the toolbar, the clipboard, and the analysis viewer.
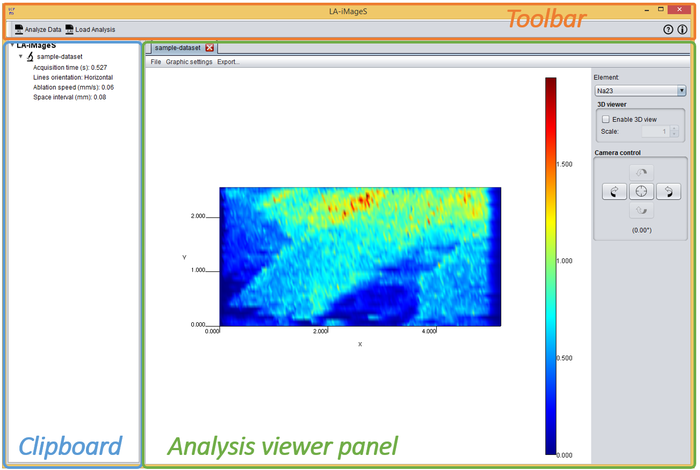
Analysis viewer
The Analysis Viewer panel consists of a 2D/3D representation of the current element with a menu bar and a right sidebar with several configuration options. It is important to remark that the 3D visualization reflects the signal intensity of each analyte and not the real topology of the sample.
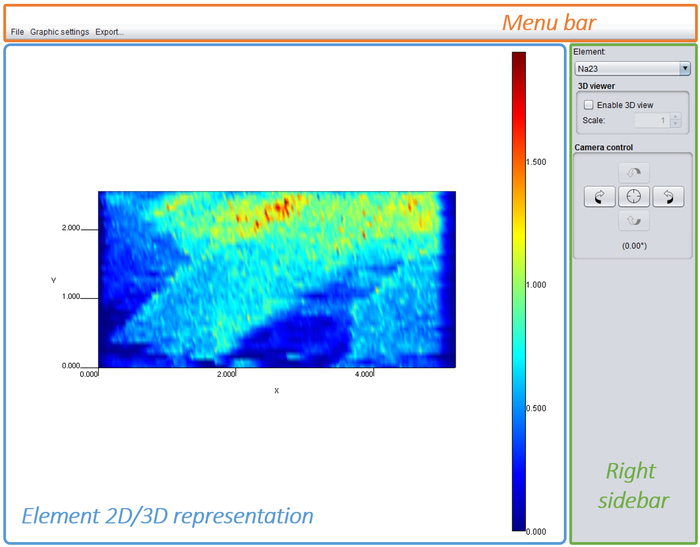
In the figure above, the ion intensity profile of 23Na+ in a section of penile cancer tissue is shown. To obtain two-dimensional imaging of element distribution, the region of interest was systematically screened (line by line). The spot size of laser was 65 μm. The highest values of 23Na+ are presented in red and the lowest in blue. The change in ion intensity demonstrates an inhomogeneous element distribution in the line scan measured. The SLC8A1/NCX1 gene expression is associated with the sodium distribution in penile cancer, which is compatible with the function of this gene. Thus, an increased sodium distribution is presented in the top of the tissue, which corroborates with healthy status of the donor and to histopathological evaluation.
Customizing elemental distribution images
The Graphic Settings submenu of the Analysis Viewer allows you to customize elemental distribution images. This menu allows you to:
- Change the Interpolation Level. By default None is selected, which means that no interpolation is applied.
- Change the Color Map used to render the data.
- Change the Range Mode. This option allows you to change the color map range, which can be: Element, so that the element range is used; Dataset, so that the dataset range is used; and Custom, so that you can use a custom range.
- Show/hide the Color Bar Legend.
- Show/Hide the Axes.
- Show/Hide the Axes tick lines.
- Reset configuration to default settings.
